

StatsBomb is reckoned to have the most sophisticated expected goals model. In the sense that it accounts for variations in the height and speed of the ball.
Don’t worry, this isn’t going to be a discourse into the merits and weaknesses of various xG models! Oh no, it’s much worse than that. By their model, Celtic has the worst average xG per shot conceded in the league.
READ MORE: 571 minutes of Gustaf: The curious case of Lagerbielke at Celtic - Tony Haggerty
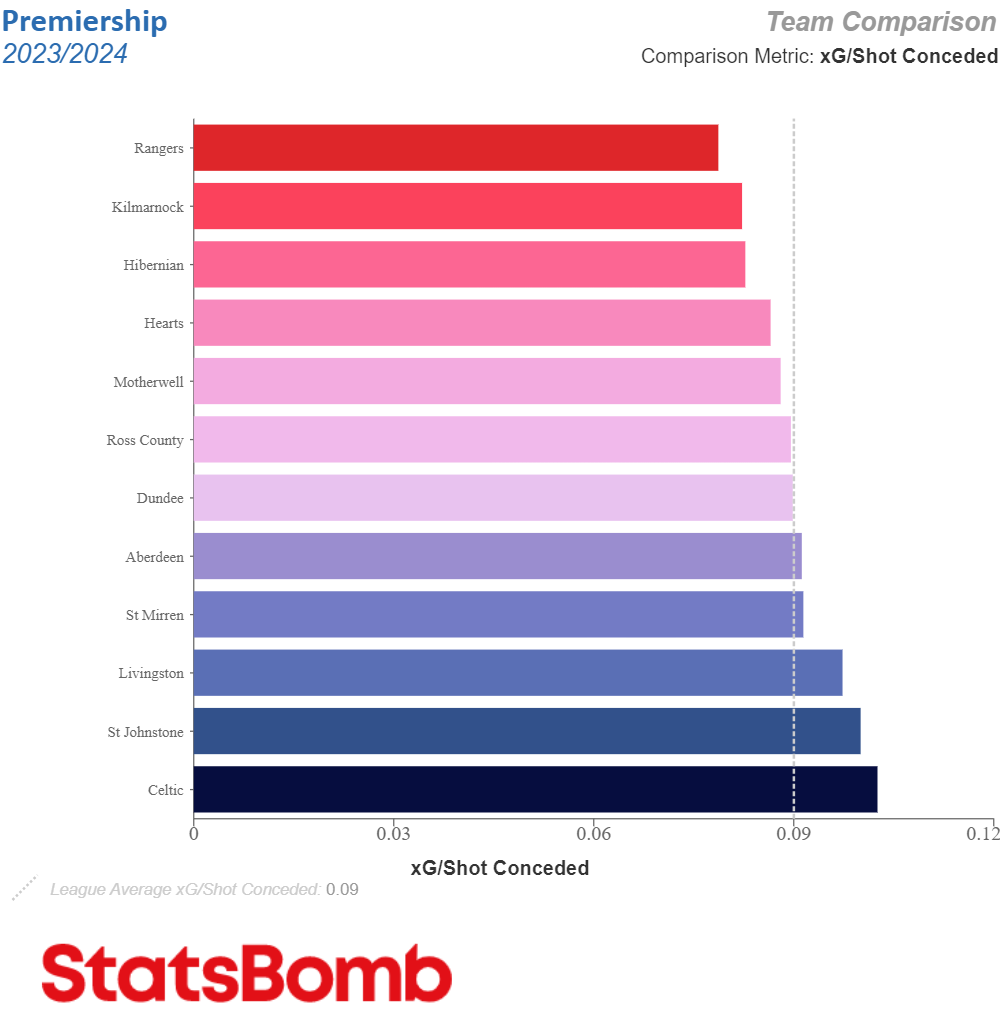
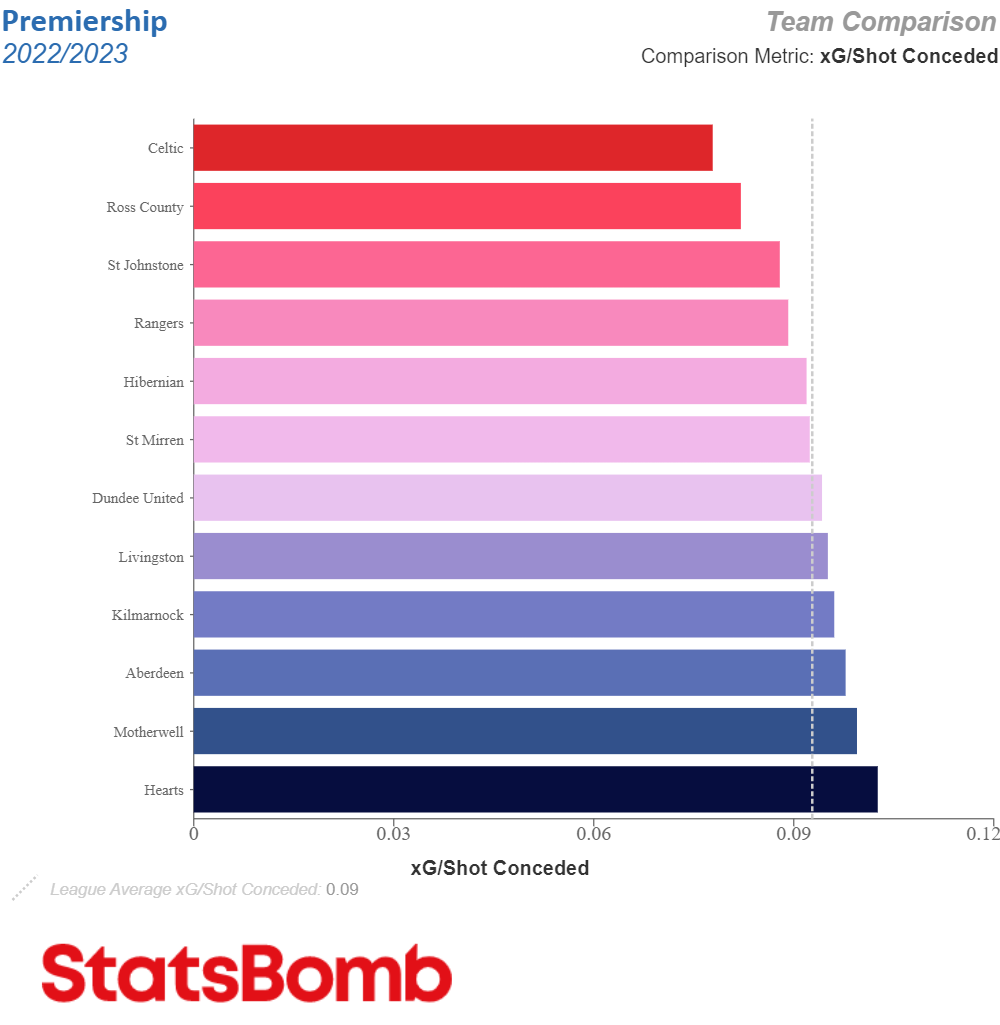
Their closest challengers have the lowest average xG per shot conceded and so this is some cause for concern. Last season, Celtic were “top” of this league in that they had the lowest average xG per shot conceded.
How can the team go from the more miserly to the most profligate in terms of allowing the opposition to generate quality shots?
All shots
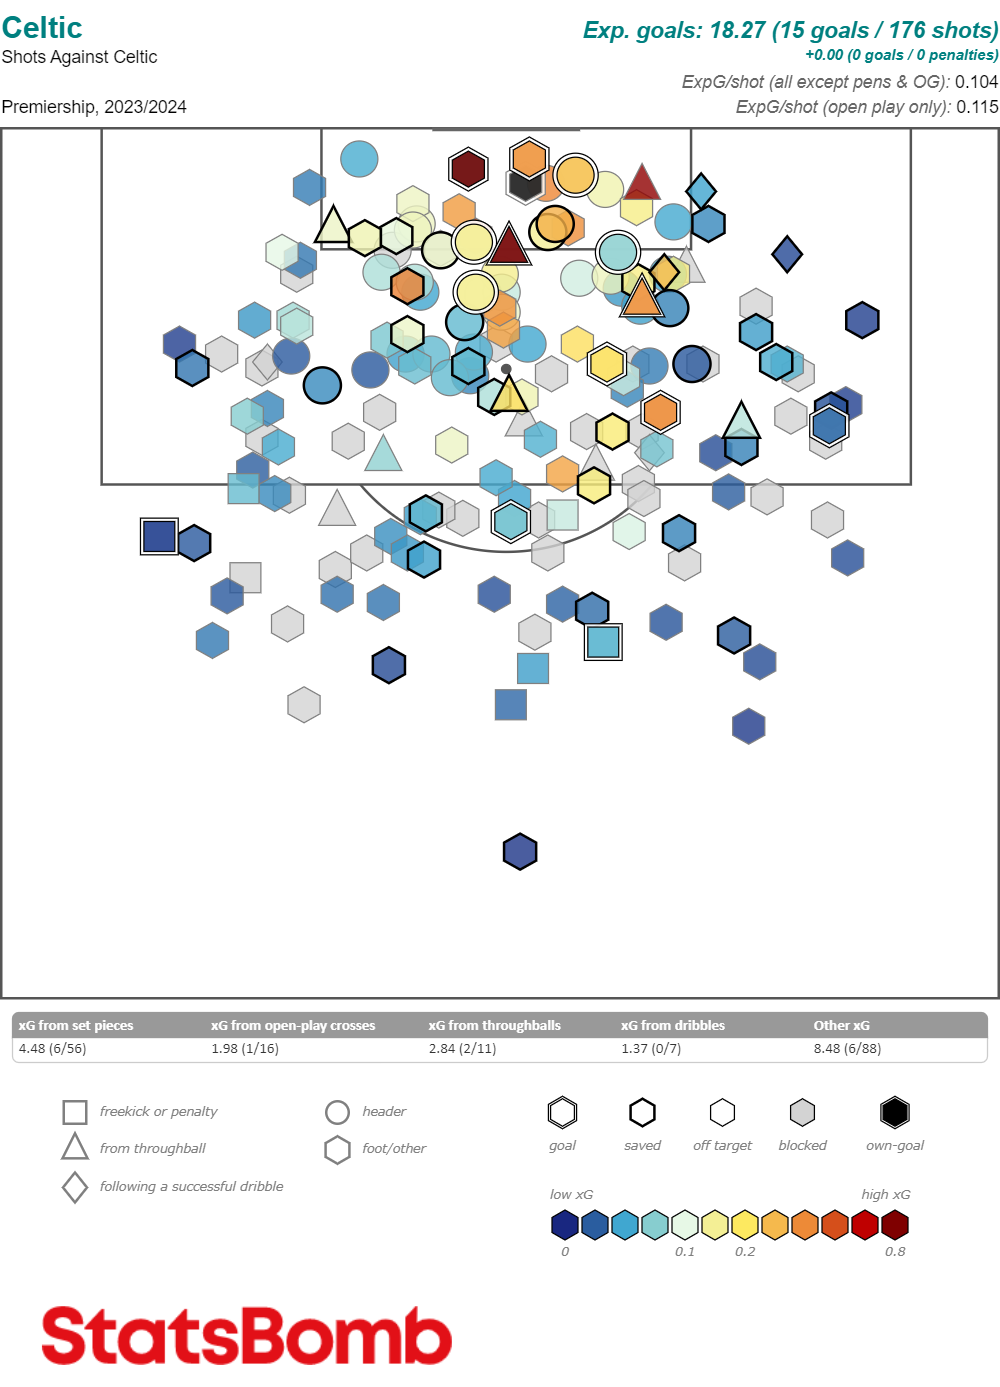
Here is the shot map for all shots conceded by Celtic in the league this season.
For comparative purposes, here is last season's shot map:
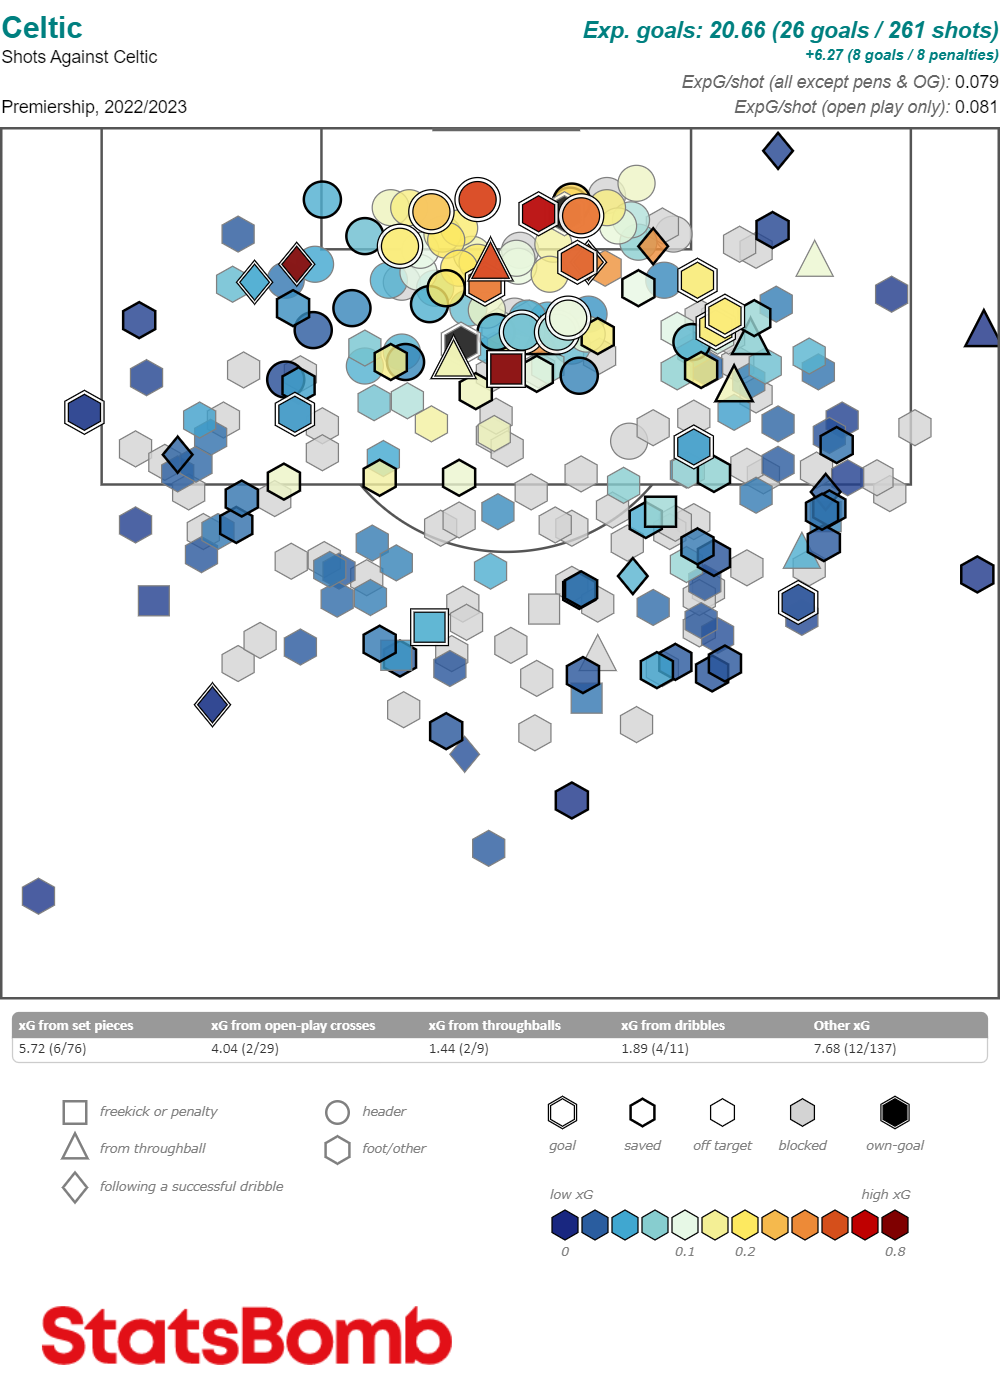
Alarmingly, from open play, the average xG per shot has risen from 0.081 to 0.115 - a 42 per cent increase. Many more shots are simply being taken closer to the Celtic goal. If you flick your eyes between the two images you can see this.
Last season Celtic were the most successful side in the league in limiting the distance from which opponents had to shoot, on average. Other sides were taking shots from 17.31 metres on average. This season, Celtic is bottom of this league with opponents now shooting from 14.98 metres on average, the closest to goal that any side allows.
READ MORE: Will Celtic play Bernardo or Hatate when both are available?
The other consistent pattern, something that was apparent last season and not been addressed, is that there are far more shots originating from the Celtic left-hand side of the defence versus the right. It seems Alistair Johnston and Cameron Carter-Vickers are better able to inhibit shot-taking from the right-hand side than Greg Taylor and Liam Scales on the left. This was also true last season with Carl Starfelt.
From open play Celtic average 0.59 xG conceded per game – but this is only the second lowest in the league. Last season they had the most frugal defence with 0.38. Also, Celtic are simply allowing more shots – 7.61 versus a league-best 6.82 in 2022/23.
Counter-attacks
Last season Celtic had the lowest volume of xG conceded from counterattack situations. They averaged just 0.34 xG per game from such scenarios. This season that has risen to 0.52, which is only the third lowest in the league.
Set-pieces
This season, Celtic have already conceded 4.48 xG total from set pieces in 23 matches compared to 5.72 for the whole of last season’s league campaign and as many goals (six) as in 38 matches last term. Last season. Celtic averaged 0.15 xG conceded per game from set pieces – this was the lowest in the league. This season that has risen to 0.19 which is the second lowest in the league.
From corners specifically, the xG conceded has doubled from a miserly and league-best 0.07 xG per game to 0.14 now the second-best in the league.
Why the decline?
Key personnel are the centre-backs and goalkeeper. They can deal with a lot of high crosses from set plays being usually the tallest players, whilst the ‘keeper can use his hands.
Last season from the start Cameron Carter-Vickers and Moritz Jenz were the starting pair in 11 matches up to November when Carl Starfelt’s injury cleared, and he formed the back line with the American. This season - as has been discussed - there has been an ever-changing backline and often a centre-back has had to be swapped out during a game. The previously unheralded Liam Scales has been the only constant.
The lack of continuity amongst the centre-backs may well be undermining defensive organisation and consistency. There have been six different combinations at centre-back. Carter-Vickers and Liam Scales have appeared together 14 times in 29 matches, less than 50 per cent of the available fixtures. The next most common starting alignment is Scales and Gustaf Lagerbielke with six. In 13 matches one of the centre-backs has been subbed off. Normally, the centre-backs are not removed from play. Carter-Vickers has appeared hampered by injury.
The left-hand side where more shots are given up than on the right is an existing issue that has not been addressed by recruitment. Teams have and continue to target that side of the Celtic defence. Simply Celtic needs to get the equivalent quality of personnel on the left as there is on the right.
READ MORE: Why is Celtic's Kyogo Furuhashi struggling this season?
The decline in Joe Hart’s capabilities has been discussed many times. He is bottom of the league table for positional errors. StatsBomb defines this as:
“How far from the optimal position for facing a shot the Goalkeeper is (on average). This metric is modelled from a starting point of the average location of goalkeepers from 20 shots from similar locations and the deviation from that average is the distance away from the "optimal" location for any given goalkeeper location on a shot.”
Hart is on average 1.89 (StatsBomb do not explain whether this is centimetres or what) out of position whilst the next highest positional error value is Zach Hemmings of St Mirren at 1.68. This may simply be both mental and physical speed of reaction in terms of where to position oneself in anticipation of a shot.
There is nothing new in any of this analysis but simple shot data highlights some of the key areas Celtic are declining in relative to their challengers and since last season. Just as well it will all be addressed in the January window.
Oh.


Comments: Our rules
We want our comments to be a lively and valuable part of our community - a place where readers can debate and engage with the most important local issues. The ability to comment on our stories is a privilege, not a right, however, and that privilege may be withdrawn if it is abused or misused.
Please report any comments that break our rules.
Read the rules here