

This article doesn't take into consideration data from this weekend's draw with Motherwell.
The cornerstone of the analytics revolution has always been expected goals. Being able to put a number on shot quality was a huge step forward as it spoke to the performance of the team generating it versus the set of facts after a match that simply reflected the outcome.
Speak to any coach of any sportsperson in the world at an elite level and they will focus on performance and on controlling the variables you can control and ignoring the ones you cannot.
So transformative did Tony Bloom and Matthew Benham consider xG-led analysis of football performance, that in the harsh, unfeeling, unforgiving world of high-end sports betting, they set out to build models utilizing the new metrics sharing the results with their high-paying clients. Both now own hugely successful football clubs in Brighton and Hove Albion and Brentford respectively. I say “hugely successful” relative to the history and performance of those much-loved English institutions.
Yes, some of us are old enough to remember “and Smith must score” but these two hitherto lower league clubs are now serious Premier League outfits, yet remain minnows amongst giants by club most size-based metrics.
Back to Celtic and xG.
A periodic analysis I like to share with you is the difference between xG scored and conceded on a rolling basis. I chose six matches to take rolling averages over, it could be five, seven or ten. ‘Rolling’ helps to even out the odd single-match anomaly like winning 9-0 at Dundee United or conceding about five penalties at Tynecastle.
To lead you to where Celtic currently are, and to highlight what this means both at home and in Europe, I wanted to take you on a short journey!
Rodgers mark one
There are not enough European matches to make the rolling average view work. So, I’ll focus on the SPFL only for now. Here is the rolling average position for all of Brendan Rodgers’s matches the first time around.
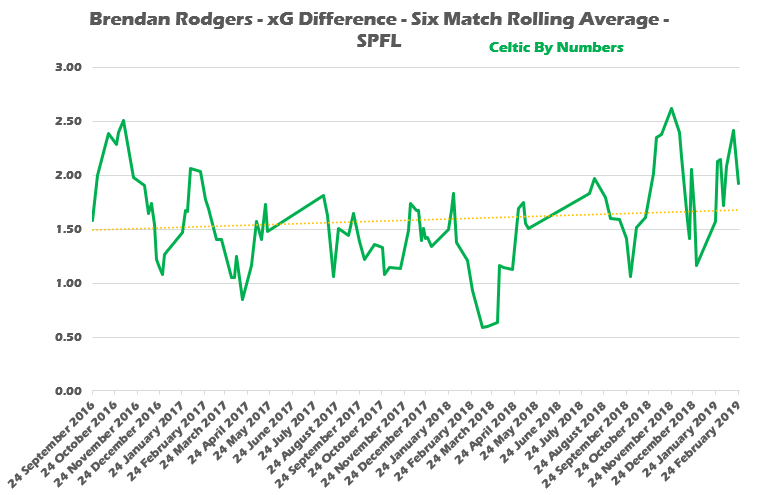
What may surprise some is that over time, the difference between xG for and against was growing positively towards the end of his reign.
Instinctively, a typical narrative of that time is a thrilling unbeaten treble season followed by increasingly pedantic football. Yet, Rodgers started with an average 1.5 xG difference per game and that was on average increasing towards 1.7 over his two and three-quarter seasons. Think of this as efficiency over style. The football may have been possession-heavy, and the goals volume dropped off, but then so did the opposition threat to a greater extent.
Postecoglou
I will now jump forward to Ange Postecoglou as once again we have a prevailing narrative, especially in Scotland, of an increasingly awesome attacking machine that had the additional impact of being so overwhelming the opposition barely had the energy to generate an attack.
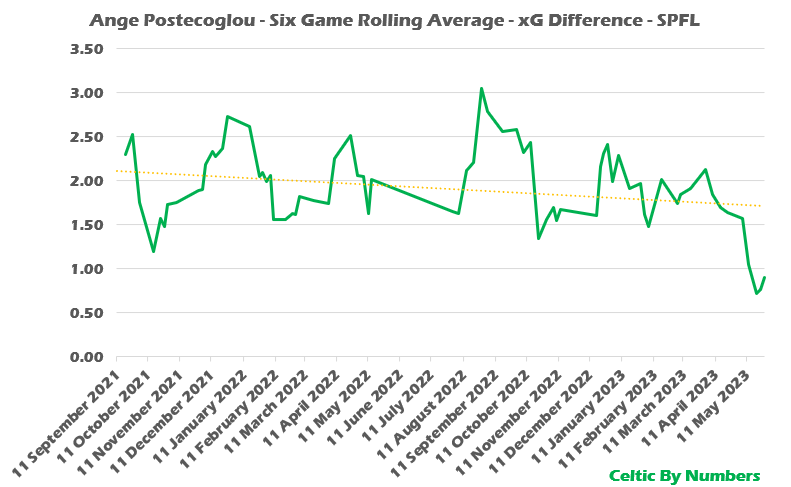
You get a similar big bang at the start of the season with fresh squads and good pitches, with a big dip as European football kicks in, but the main takeaways encouraged here are the trends. Over the course of the two years of Ange, the xG differential was declining BACK TO the level achieved by the time Rodgers left.
Now, we must acknowledge that the team fell off badly in 2022-23 once the league was won and, in retrospect, once many had suspected the manager was off. We must also acknowledge that Postecoglou had the team performing such that there was an average +2 xG differential in each game which as we will see later is very hard to play against. I suspect then that those respective trends were contrary to the expectations of many.
What of this season?
Rodgers mark two
We know that with key players leaving, an injury outbreak, a new manager, and a rather idiosyncratic arrangement of initial fixtures, it hasn’t been the easiest start. We must also acknowledge the small sample sizes so far, especially in formulating a six-match rolling average.
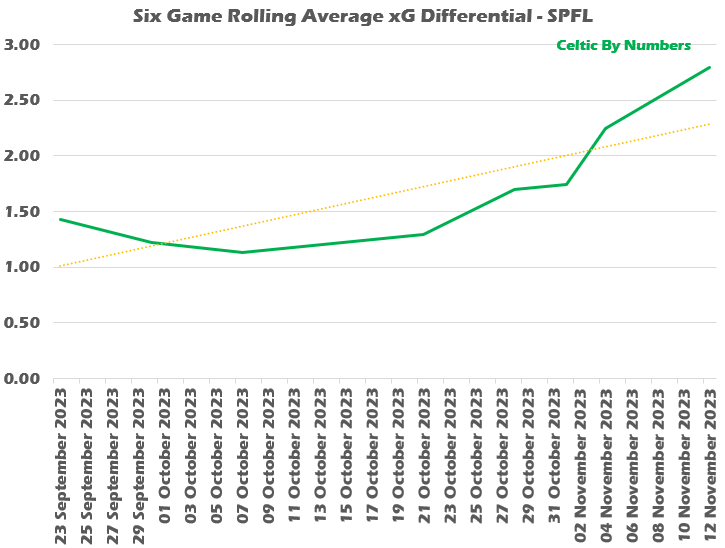
A couple of recent blowouts, aided by an early red card for Ross County and then a tired post-European tie Aberdeen crumbling at Celtic Park has certainly adjusted the trajectory.
Early season Celtic were struggling to generate more than one xG more than even the domestic opposition. Now that is moving steadily upwards. It seems, with the reverse fixtures to play from a difficult opening set, that Celtic under Rodgers may be peaking about the right time for that December marathon of matches.
I want to leave you with a view I’ve built on the difference in the xG differential between European games and SPFL to highlight some of the features of playing in such disparate environments.
A Differential Model
I went back to all the games I have data and xG for over eight seasons.
I categorised each match as Scottish or European. And arranged the xG difference into 0.5 xG differential bandings. I then calculated the percentage of “points” won from the matches in each banding. Think of an outcome of any football match in terms of if you win you get three points and if you draw you get one point even if it is a cup match. This allows all matches to be assessed in terms of “points” when generating overall records.
Here are the matches in Europe and Scotland plotted by xG differential banding:
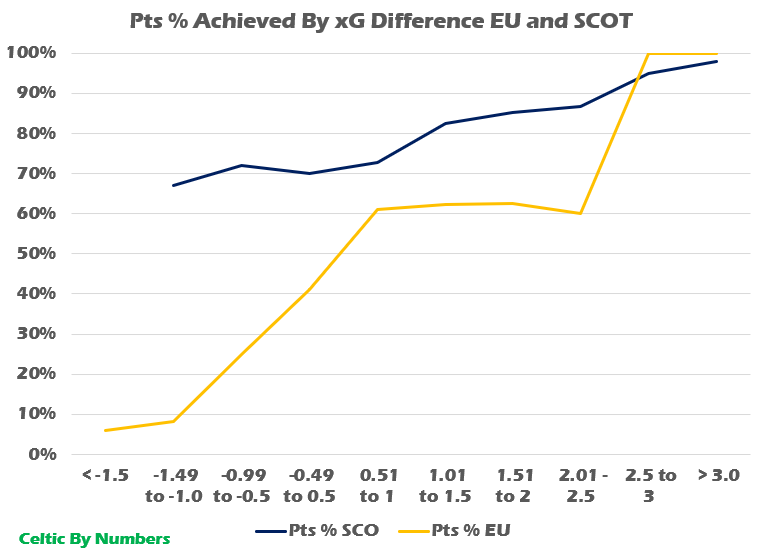
You can clearly see two very different patterns. The domestic view is probably simpler. Essentially, even if an opponent generates up to +2 xG MORE than Celtic, the Hoops are going to win around 70 per cent of the “points”. This does not vary much between an opponent generating one 1 xG less than Celtic or up to 2 xG more. The lesson is: that there is merit in keeping games very tight against the Champions. Even if you attack relentlessly, you will only ‘win’ on average 30 per cent of the points and that doesn’t decrease by much until Celtic get to 1.5 xG-plus.
Back to our prior graphs, and the importance of the trendlines and can Celtic exceed that 1.5 xG difference on average? If they can, the percentage of points won leaps up to 83 per cent plus until you get to 3+ xG difference where Celtic have only failed to win one match in recent times – a home 1-1 draw with Motherwell.
Europe is a very different arrangement. Once the xG difference is over 1 xG to the opposition, Celtic are winning just eight per cent of points. Between -0.5 and -1 xG against it is only 25 per cent. Even when the range is -0.5 xG to +0.5 xG Celtic are only winning 41% of the points. Even MORE alarmingly, even if Celtic manage to generate 2.5 MORE xG than the opposition, they are only winning 62 per cent of the points! That plateau from 0.5 xG to 2.5 xG whereby Celtic’s chances of winning points barely increase also supports the notion that in Europe, Rodgers is right to keep it tight and stay in the game.
Both aspects of the model support the same conclusion despite the very different distributions. Firstly, in Scotland, going all-out attack versus Celtic will not greatly enhance your chances of points. Stay in the game. Similarly, for Celtic in Europe, the exact same principle applies.


Comments: Our rules
We want our comments to be a lively and valuable part of our community - a place where readers can debate and engage with the most important local issues. The ability to comment on our stories is a privilege, not a right, however, and that privilege may be withdrawn if it is abused or misused.
Please report any comments that break our rules.
Read the rules here